(name changed due to NDA)
Designing a Central Operations Dashboard to Drive Clarity, Efficiency, and Trust in GenAI-Powered Software Testing
Mentexa.ai is an internal GenAI-powered testing tool for an enterprise QA company. It automates test creation, aiming to reduce QA timelines and increase accuracy. The tool was built and deployed when I joined, but no one could tell if it was working.
I joined the team midway through the project to lead UX for the next phase, designing a central dashboard that would give decision-makers the clarity and control they lacked.
Type
Enterprise SaaS
Central Operations Dashboard
Generative AI
Team
Co-Founder
Design Manager
Senior UX Designer
Product Managers - 2
Developers - 2
UX Designer - me
Contribution
User Research
Information Architecture
UX and UI Design

Visual Design and UI have been altered to keep up with the current industry trends and reflect my craft
The Starting Point (How It All Began)


From
A GenAI-powered tool that automated testing and promised efficiency, without a clear way to prove it was working.
No visibility. No data. No trust.
To
A strategic product expansion that made AI performance visible through real-time dashboards, turning adoption hesitation into data-backed confidence.
What Changed Because This Shipped?
After release, Mentexa had a single source of truth for operational health, clear role-based visibility without overwhelming anyone, and faster alignment between leadership, ops, and execution teams.
-
40%
reduction in manual tracking efforts for Super Admins
-
50%
faster decision-making with centralized, real-time data


.png)


Where I Entered the Story (Mid-Build, No Clear Brief)
There were no clear requirements for what the dashboard needed to do. So I created them.
-
Interviewed the support team, who were handling confused calls from users and admins to map pain points and understand the system
-
Synthesized needs across PMs, engineers, and client stakeholders
-
Did a quick competitive scan of platforms like Salesforce and Asana to benchmark visibility features

What I Heard When I Started Listening
"We’ve built this powerful AI tool, but how do we show that it’s saving time and making teams more efficient?"
- A recurring concern from PMs and Engineers

The Real Problem Revealed Itself
As QA work scaled through automation, visibility didn’t scale with it.
Leaders needed a way to see, trust, and act on real-time work, without slowing teams down.

Why Mentexa Needed a System, Not Just Screens
This wasn't just a design task; it was about creating a measurable foundation for an advanced AI product.
LEADERSHIP NEEDS
SIGNALS REQUIRED
VISIBILITY GAP
SYSTEM I DESIGNED
Identify teams that need support
Reward top performers
Reassign work across teams
Track token usage and forecast needs
Measure ROI of AI testing
Understand adoption across orgs
Trust AI output for decisions
Team performance and workload
User activity and output
Ownership and team mapping
Token consumption
Usage vs Efficiency
Active vs Inactive users
Explanable insights
No org wide visibility
Performance buried in logs
No structured team layer
Invisible across org
No proof of value
Fragmented data
AI felt like a blackbox
Org - Team - Users
Performance Metrics
Team assignment controls
Token visibility at all levels
Efficiency and Impact in dashboard
Centralised usage tracking
AI insights layer translating activity and efficiency
Turning Complexity Into Something Leaders Could Read

The challenge wasn’t adding information; it was editing ruthlessly. I designed a central operations dashboard that:


Surfaced only what was decision-critical

Used hierarchy and structure to guide attention

Balanced depth with scannability
And Here's What I Finally Built
CENTRAL OPERATIONS DASHBOARD
Efficiency & Impact
Centralized Usage Tracking
AI Insights
Token Visibility
Performance
-
The goal of this dashboard was to provide all key information on a single screen, prioritized and organized in a way that made sense to leaders.
-
This key dashboard solves the major challenges of providing visibility into the org and building trust in the new Gen AI testing model.
-
The data is nested in hover modes to prevent information overload. This is the main tool for leaders now to take informed actions.


Visual Design and UI have been altered to keep up with the current industry trends and reflect my craft

.png)
USER AND ROLE MANAGEMENT
Org - Team - Users
Team Assignment Controls
AI Insights
-
Allows leaders to oversee information for each user and assign or edit their roles and teams.
-
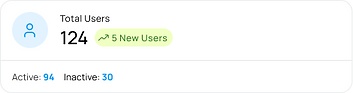
Leaders can view data of active and inactive users according to time, roles, and services.
Visual Design and UI have been altered to keep up with the current industry trends and reflect my craft
PROJECTS AND TEAMS MANAGEMENT
Org - Team - Users
Team Assignment Controls
AI Insights
-
Allows leaders to oversee information for each team, their performance, and the users assigned.
-
Leaders can view data of active and inactive teams according to time, roles, and services.
-
Teams can be edited, and users can be assigned to different teams if needed.


Visual Design and UI have been altered to keep up with the current industry trends and reflect my craft

Designing While Shipping (Iteration in Real Time)
This project didn’t happen in a vacuum. I was designing while engineering was actively building, requirements were evolving, and feedback was coming in mid-sprint. That meant tighter loops, faster decisions, and constant tradeoffs. Not everything could be perfect — but everything had to be intentional.

What Changed After Release?
Once the MVP shipped, the impact was immediate. This wasn't the final product but a foundation that teams could build on.
-
A shared view of operations
-
Less back-and-forth to explain status
-
More confidence in decision-making


This is a clip from one of the testimonials for the product.

This wasn’t about aesthetics.
It changed how decisions were made and how fast teams could respond.


What This Project Taught Me
-
Adapt quickly and talk about the challenges to stakeholders and the team before designing.
-
Calling the shots in ambiguity and working with the PM and engineers to work faster and find solutions.
-
This was a small part of a very complex software. It taught me how to design with scalability in mind and move fast by making trade-offs and prioritizing pain points. Sometimes, you have to trade off pixel perfection for problem-solving.
Explore Other Projects
.jpeg)
Health Tech · Consumer Product · AI · 0 to 1